

by: Leonardo Corbucci 10 Gennaio 2024 12:56
Performance of photovoltaic modules in vertical installations and the thermal dispersion coefficient UC.
Studies, results, and feasibility of vertical photovoltaic systems.
The present analysis is based on research tests conducted by EPJ Photovoltaics 14, 32 (2023) © A.J. Carr et al., Published by EDP Sciences, 2023 https://doi.org/10.1051/epjpv/2023027
Special Issue on ‘EU PVSEC 2023.’
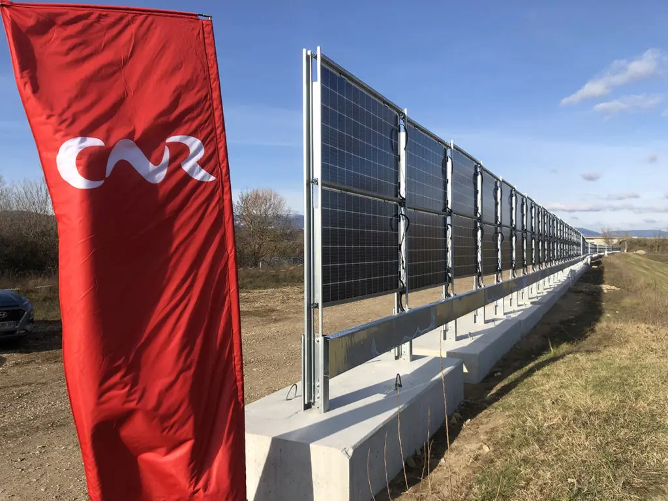
Vertical installations (modules positioned with TILT=90°) currently represent a niche within the context of designing photovoltaic systems, be it commercial, industrial, or agricultural. However, vertical installations are often underestimated by designers both in terms of feasibility and performance.
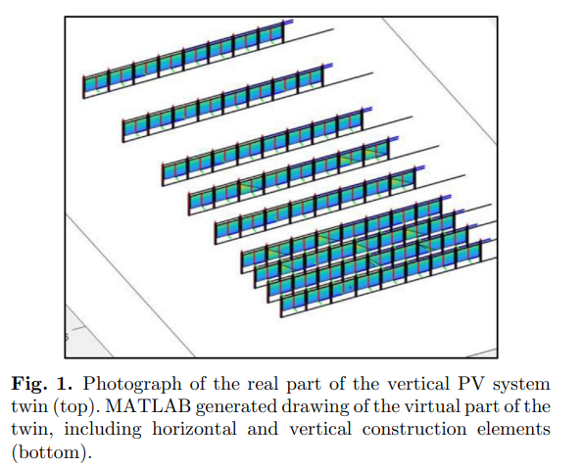
The purpose of this analysis is to highlight some recent empirical studies regarding vertical installations and the surprising results achieved.
Module temperature and operating voltage (Field TEST).
The electrical performance of the modules was modeled using single-diode parameters fitted to I-V measurements at STC. For module temperature, a steady-state model similar to PVsyst was employed. The standard heat exchange coefficient value for open rack mounting, specifically Uc = 29 W/m2/K, is utilized under the label ‘set,1’ [12].
The two figures below depict both the measured and modeled REAL module temperatures for a sunny day in September.
It’s noticeable that due to the vertical positioning of the solar panels, the irradiance on the panels is low around solar noon, causing a significant reduction in module temperature. It appears that the observed module temperatures are much lower than the theorized values.
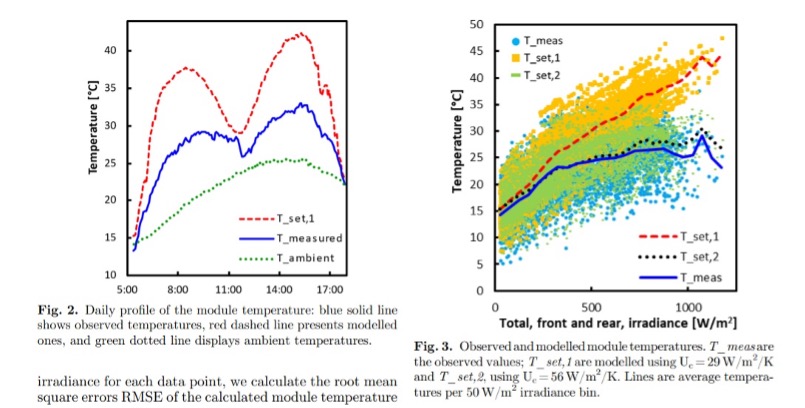
Looking at a broader dataset of observed module temperatures and total irradiance on the front and rear planes, we find that a Uc of 56 W/m2/K provides the best approximation between real field observations and theoretical module temperatures.
For simulations using the updated thermal coefficient value, the label ‘set, 2’ is employed.
The figure illustrates the module temperature in relation to the total, front, and rear plane irradiance from August 26th to October 4th, 2022.
Due to the extensive data points, the average module temperature per unit surface of 50 W/m2 has also been calculated and plotted.
The root mean square error (RMSE) for the default and updated values compared to the measured values is 9.9 and 1.5, respectively.
Clearly, ‘set, 2’ exhibits much more consistency between the measured and theoretical data.
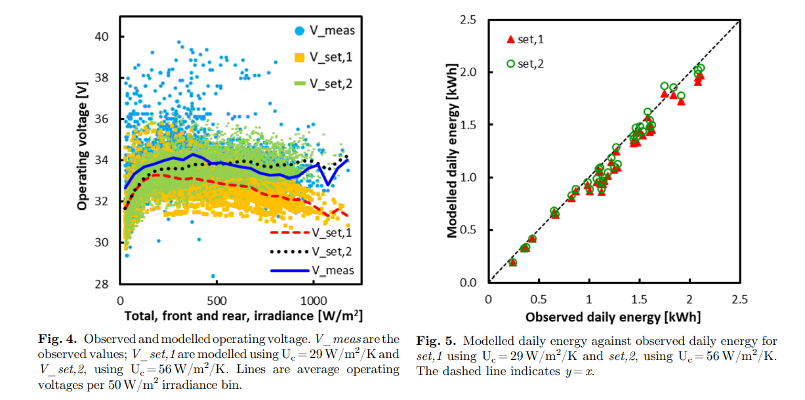
Figure 4 displays the corresponding operating voltage.
Although there are some differences between ‘set, 2’ and the measured values, the adjustment is much better compared to the original model.
Particularly at higher total plane irradiance, the operating voltage for the original model decreases due to the considerable increase in module temperature, while for both the measured and ‘set, 2’ models, the decrease in voltage caused by the rise in module temperature is mostly offset by the increase in voltage due to increased irradiance.
Note: Near the maximum power point, the P-V curve is nearly flat.
This means that with an operating voltage varying by ±1% from the maximum power voltage, there will be only a 0.1% power loss.
In an outdoor installation, conditions constantly fluctuate, making the measured operating voltage an approximation of the maximum power point voltage.
The agreement between observations of the power optimizer voltage and the modeled maximum power point voltage using ‘set, 2’ shows a root mean square error of 0.5 compared to the RMSE of 1.3 for the default value in ‘set, 1’.
Effects on the produced energy.
Finally, the electricity generated by the system on a daily basis was examined by plotting the modeled daily energy using both the default and updated Uc values against the observed daily energy.
For the default Uc, the slope of the modeled daily energy compared to the observed one is 0.95, whereas for the updated value, the slope is even closer to unity, specifically 0.99.
Note that the Uc is updated to reflect the measured module temperatures and is not compared to hourly power or daily energy yield.
In Figure 6, the relative increase in daily energy is highlighted, comparing the model with the updated thermal exchange coefficient value to the default value against the observed daily energy.
There is a clear trend where the relative increase also rises with the increase in observed daily energy.
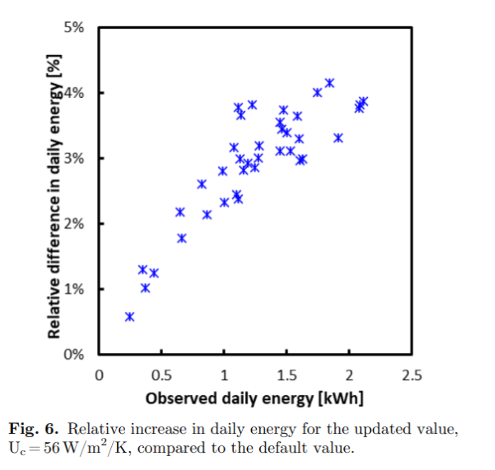
On days with the highest observed daily energy yield, the relative increase reaches up to 4%.
Naturally, the observed daily energy yield will be highest on days with high total irradiance.
Under these high total irradiance conditions, modules will absorb a considerable amount of heat, both from infrared heating and excess energy in photovoltaic conversion.
> As a result, on these days, the temperature difference between modules operating with different thermal transfer coefficients will be maximal.
> Consequently, modules with higher thermal transfer coefficients will exhibit the greatest increase in energy conversion on days with the highest irradiance and daily energy.
Further investigation was carried out to determine if the results in Figure 6 depend on factors such as daylight duration or ambient temperature.
By comparing hourly values of relative differences and observed energy, the same trend is observed: a linear increase at low energy followed by a broader cloud.
A slight deviation from linearity is noted at higher energies towards a lower slope.
The ambient temperature does not have a significant impact: data points with higher ambient temperatures tend to exhibit higher relative differences compared to data points at lower ambient temperatures at comparable observed energies.
Conclusions
In vertical installations, when standard thermal transfer coefficients for photovoltaics are used, the theoretical module temperatures are too high, consequently leading to underestimated module power.
This study has highlighted that the thermal transfer coefficients (Uc) for vertically positioned modules are nearly double the default Uc values. As a result, the modules operate at a temperature differential from the environment that is almost halved.
The adjusted value for Uc results in an annual energy yield increase of 2.5%.
Therefore, vertical modules function at relatively lower temperatures with a higher performance ratio, partially offsetting the energy loss due to the non-optimal configuration (TILT).
Project developers and anyone involved in optimizing or evaluating the design of a solar park using vertical photovoltaic modules should consider the effect of increased thermal transfer coefficients for their business case.
So what?
This study effectively confirms that vertically installed modules have better heat dissipation, partially offsetting the productivity deficit due to suboptimal exposure.
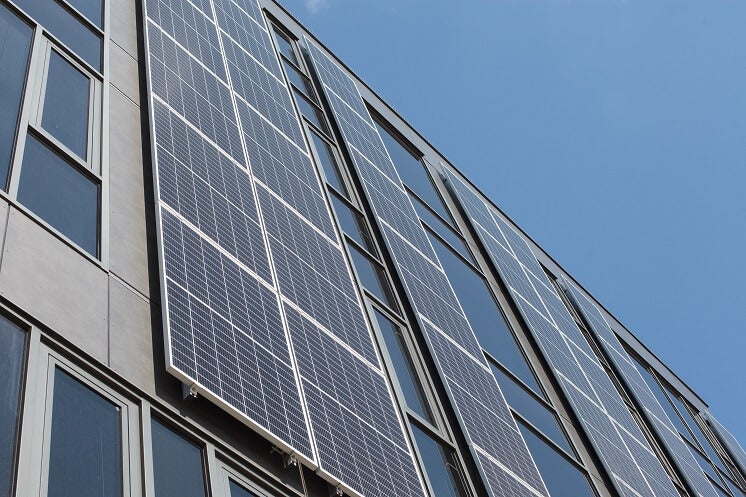
While this assumption applies in the examined case (bifacial modules, ground installations), proportionally, it may also hold true for vertical installations on facades.
Therefore, when estimating yield, it’s necessary to account for a correction in the thermal dispersion coefficient.
Recent Posts
Categories
